
Google My Business Views and Clicks: A Rebound during COVID-19
Adam Dorfman

Executive Summary
As we approach the second half of 2020, our clients continue to ask a compelling question: “How has the COVID-19 pandemic affected my online reputation, particularly the performance of my Google My Business (GMB) listing?”
This question is especially compelling. According to Reputation.com research, businesses that effectively manage their online reputations see an increase in average sales volume compared to those that do not.1 And the data shows clearly that managing a GMB listing is an essential part of reputation management. Not only is a GMB listing an influential source of customer reviews, it’s also the single-most important factor influencing how findable a location is when people do searches.2 In short, a GMB listing is the digital front door to a business.
This report analyzes the impact of COVID-19 on what we consider to be the most important elements of a GMB listing: views (a measure of someone’s potential interest in a business location) and clicks to directions, websites, and phone calls (a measure of someone’s intent to do business with your location). Our analysis covers a number of industries ranging from automotive to retail.
Key Findings
-
COVID-19 caused businesses to experience a sharp drop in GMB performance throughout March. But as America begins to re-open its economy gradually, GMB performance shows signs of coming back.
-
Even as businesses experienced drops in revenue during the first quarter of 2020, it didn’t mean customers lost interest in them. People kept visiting GMB listings and clicking to call locations, visit websites, and get directions especially in the latter half of April. In most cases, consumers did so even though shelter in place mandates prevented them from visiting physical locations. So consumers went online to make purchases instead.
-
We found that the ratio of GMB views per click dropped in April. The lower ratio of views per click shows that people were searching with intent to perform an action such as visit a business — which lessened the blow of the economic downturn for some businesses.
-
Businesses that maintained their GMB listings as COVID-19 spread were better prepared to capture the offline spend (however diminished it was) and the online spend (which surged during the first quarter) — and will be going forward.
-
Customer reviews on GMB sites are returning after being suspended by Google. Automotive is experiencing the strongest uptick in review volume, and the sentiment is very strong. It’s important that businesses pay attention to their customer reviews and respond to them under any circumstance.
Bottom Line: managing your GMB listing is essential to managing your reputation. Your GMB is the lifeline to your business, whether people are reviewing you, going to your website, calling you, or visiting your location.
81,000
GMB listings analyzed across multiple industries in the U.S.
Click interactions analyzed:
Introduction
How has the COVID-19 pandemic affected Google My Business (GMB) listings in the United States? And what is happening to GMB listings as America slowly opens up its brick-and-mortar economy?
These are important questions. A GMB listing is the digital front door of a business location. According to the most recent Moz Local Search Ranking Factors report, a GMB listing is the biggest local ranking factor. It also functions as a website for a location, with rich content, visuals and customer ratings/reviews that make it possible for people to learn more about a business without leaving Google’s search results. Under normal circumstances, people rely on a GMB listing to get essential information such as store hours and customer reviews to learn more about a business’s location. During the coronavirus pandemic, the nature of those searches changed rapidly as consumers’ behavior changed. “What are your hours?” became “Are you open while we shelter in place?” “What does your menu look like?” became “Do you offer curbside delivery?”
As a Premium Google partner, we manage business data for tens of thousands of GMB listings. For this study, we examined more than 81,000 GMB listings across multiple industries and geographic locations. We looked at metrics such as GMB views (a measure of someone’s interest in a business location) and actions such as GMB clicks for driving directions.
We wanted to know what was happening to the volume of views and clicks as the COVID-19 pandemic took hold in March and then as people felt the impact of the pandemic in April.
That data reflects a sharp decline in GMB performance — but also signs of a recovery.
Performance metrics on GMB listings provide a useful predictor of consumer purchase behavior.
1 COVID-19 Crushed GMB Views in March. But GMB Views Climbed in April.
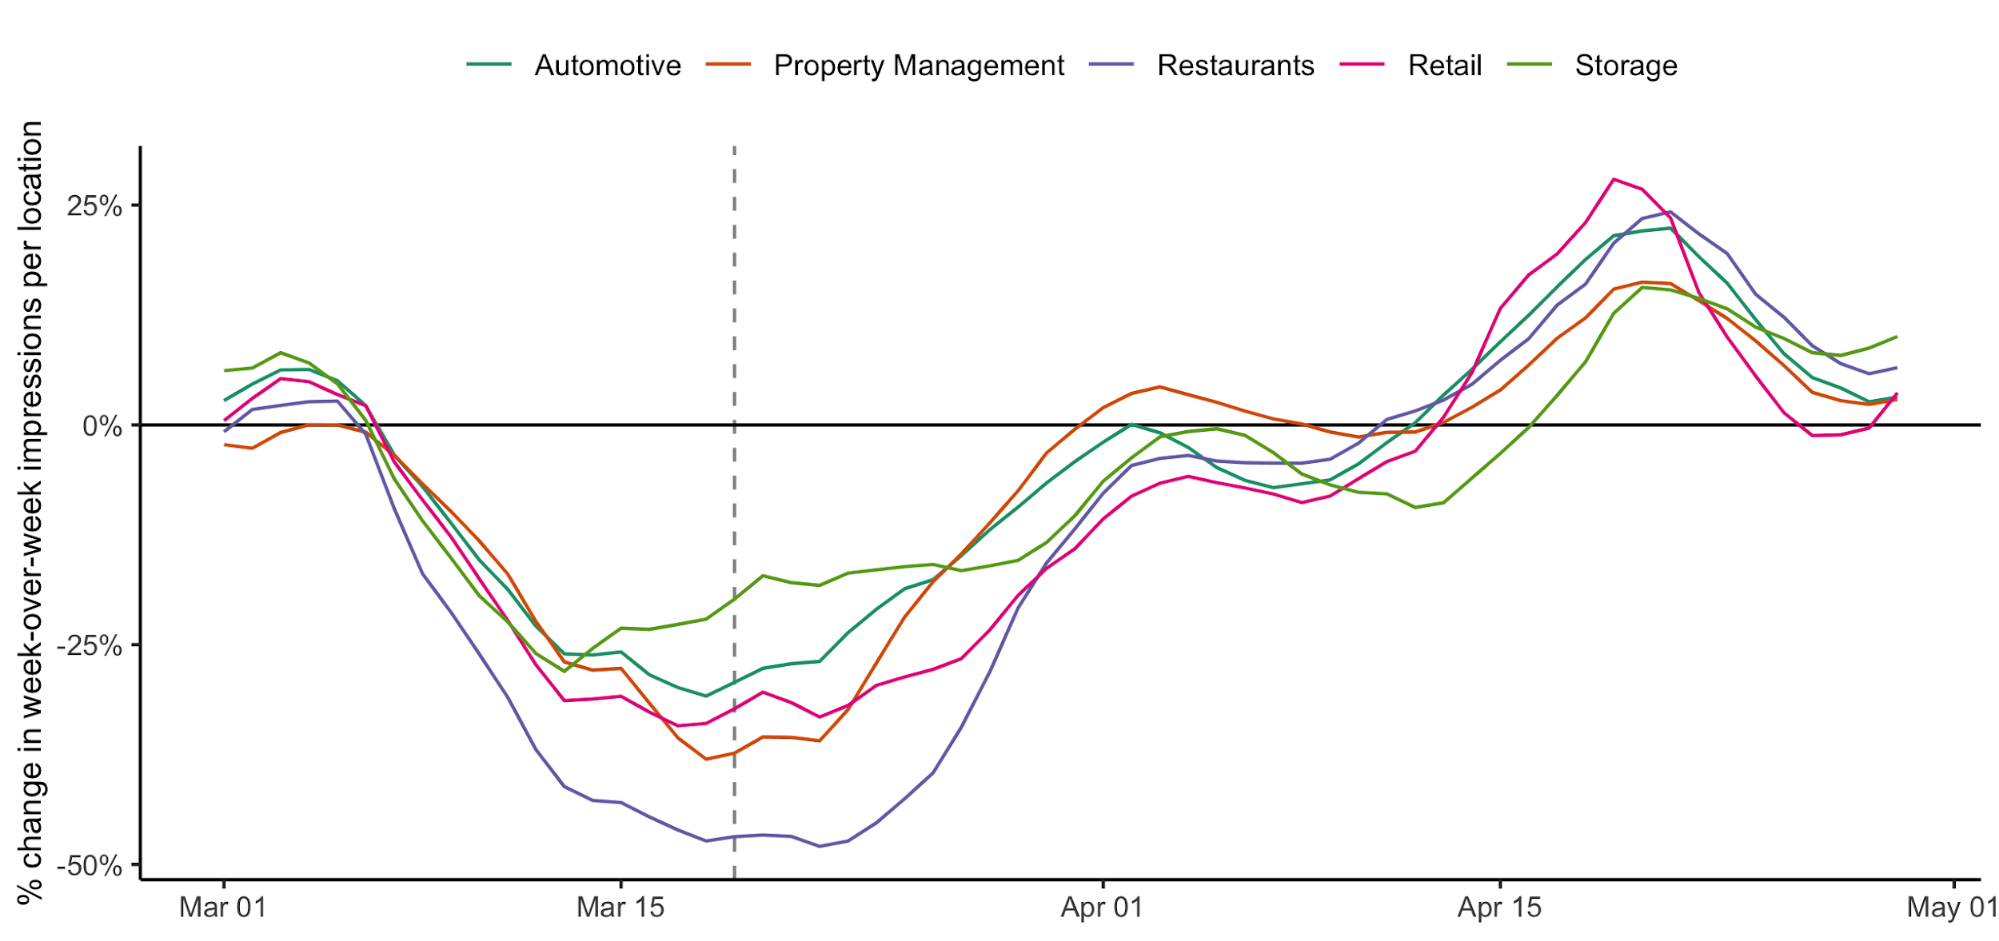
Across every industry, GMB listing views (also known as impressions) climbed steadily until about March 5. But as the pandemic took hold, views began to drop. And they continued to drop until they were 59% lower than where they were on March 5. Every industry and region got hit, especially restaurants.
The steep drop was not surprising as consumers began to shelter in place and curtail their visits to brick-and-mortar stores. But at the end of March, we noticed what appeared to be a flattening out of the data.
Indeed, in April, it’s likely the trend data mirrors some of that sentiment:
- A 24% increase in views overall – certainly not anywhere near pre COVID-19 levels, but an increase nevertheless.
- An uneven rebound. Some industries rebounded more strongly than others. The industries that showed the strongest turnaround were automotive, storage, and property management.
Percent change in week-over-week impressions per location
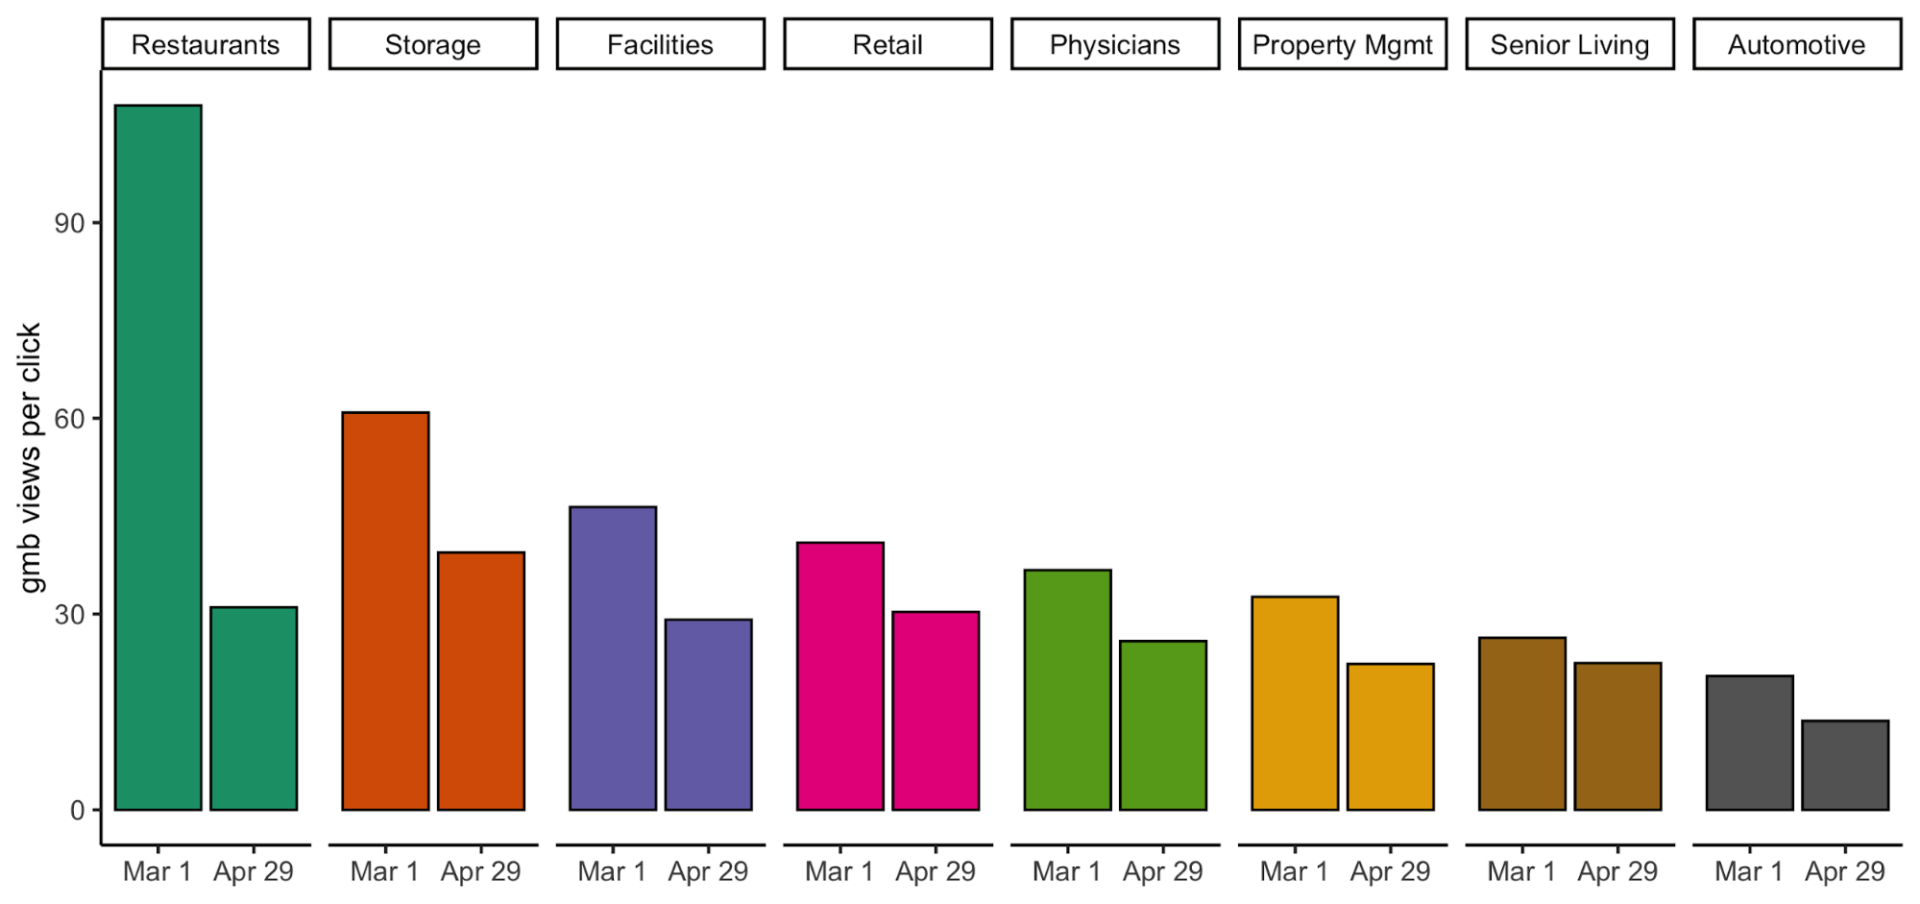
Ratio of GMB views per click went down in April
In addition, we looked at the ratio of GMB views per click. This metric gauges user intent. When a GMB listing has a low ratio of views per click, it’s more likely that people viewing a GMB listing are finding what they need more efficiently and taking action (or clicking to call, drive, or visit a website).
We found that the ratio of GMB views per click dropped in April. The following chart indicates that when people looked at a GMB listing, they were more willing to take an action such as ask for driving directions, click to a website, or click to call.
GMB views per click
2 GMB Clicks Also Showed Signs of a Return
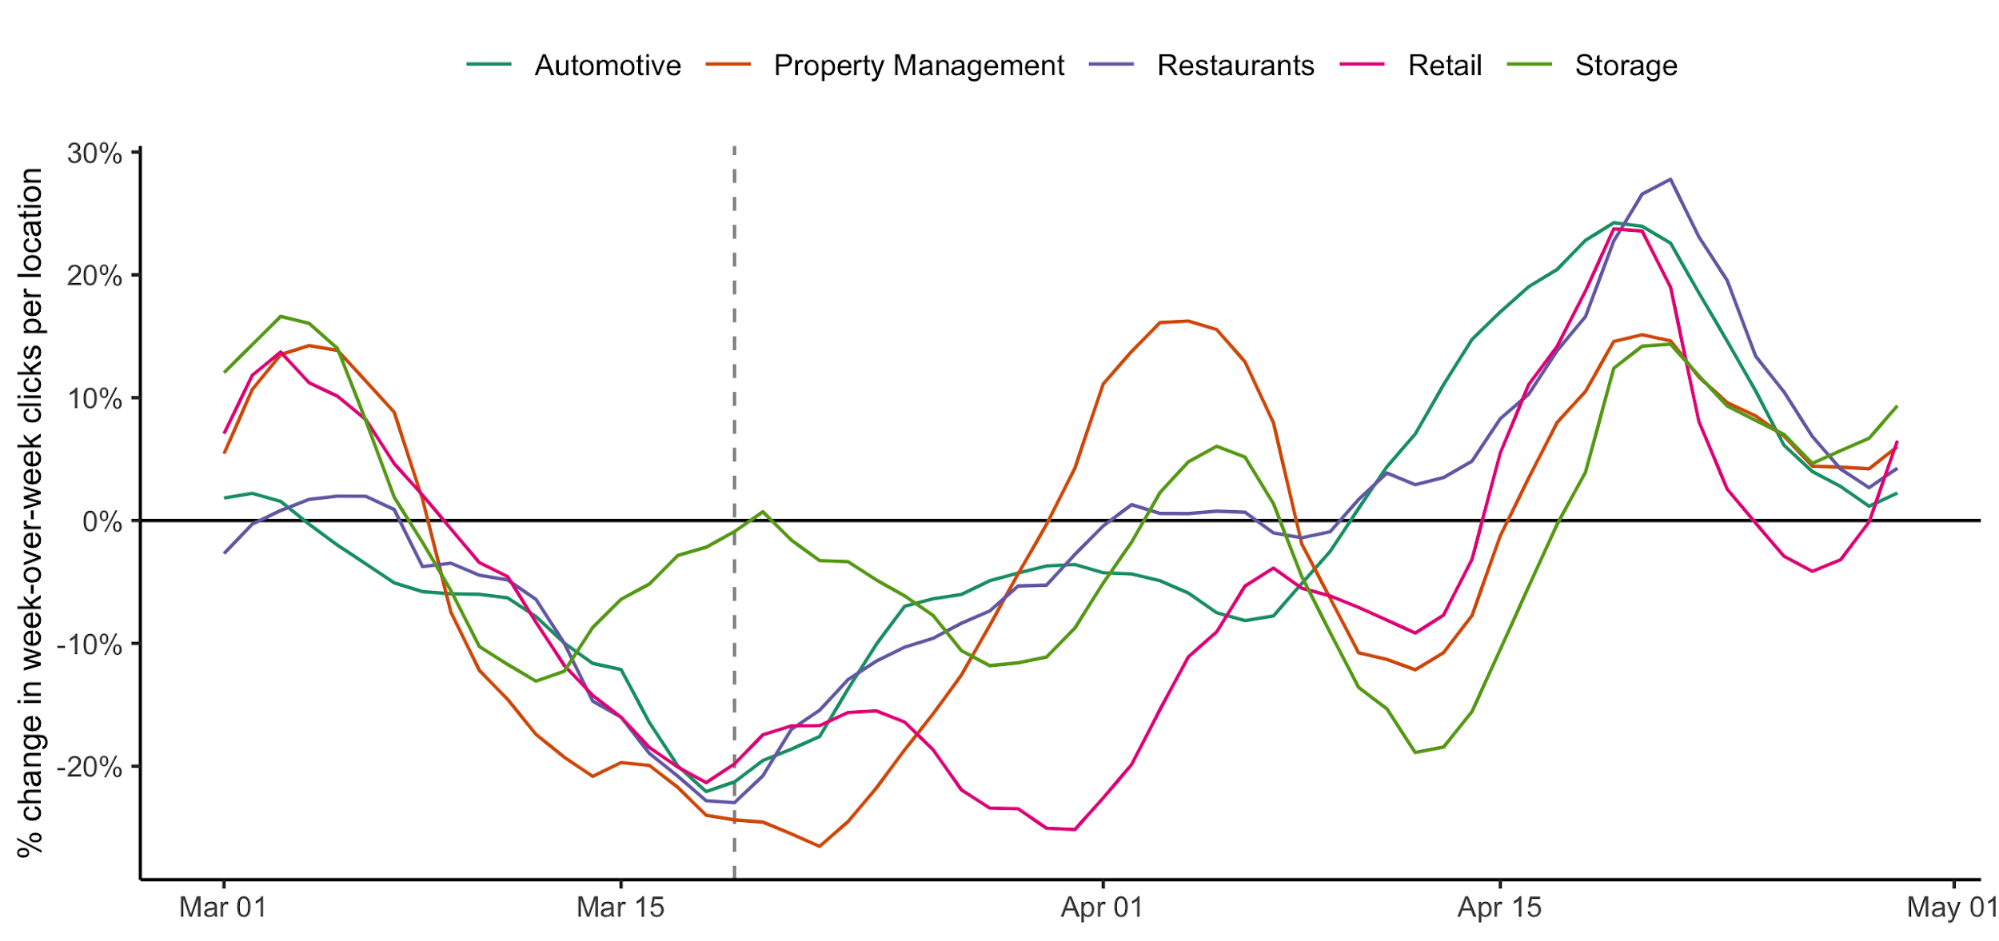
GMB Clicks to action on GMB sites – such as clicks to driving directions, websites, and calls to a business – were down by 37% overall in March. But here again, we witnessed an April rebound, with a 27% increase.
The steep drop in clicks to driving directions throughout March most certainly resulted from consumers responding to state-by-state shelter in-place mandates. But near the end of March, those clicks were bottoming out, probably as people learned more about which businesses were essential (and remained open) and which were not (and were closed). But even though clicks are down overall, clicks to phone were not hit nearly as dramatically. The data suggested that people were still interested in businesses even if they were not visiting them.
Indeed, in April, we saw a gradual recovery for all categories of clicks (directions, phone, and web). As with views, the click data showed a stronger recovery for some industries more than others — with automotive, restaurants, and property management leading the way.
It’s interesting to note that when we examined customer reviews of the automotive and property management industries during the pandemic’s outbreak, we noticed largely positive feedback. Customers appreciated how automotive dealers and property managers were adapting their service to meet customers’ needs a time of social distancing.
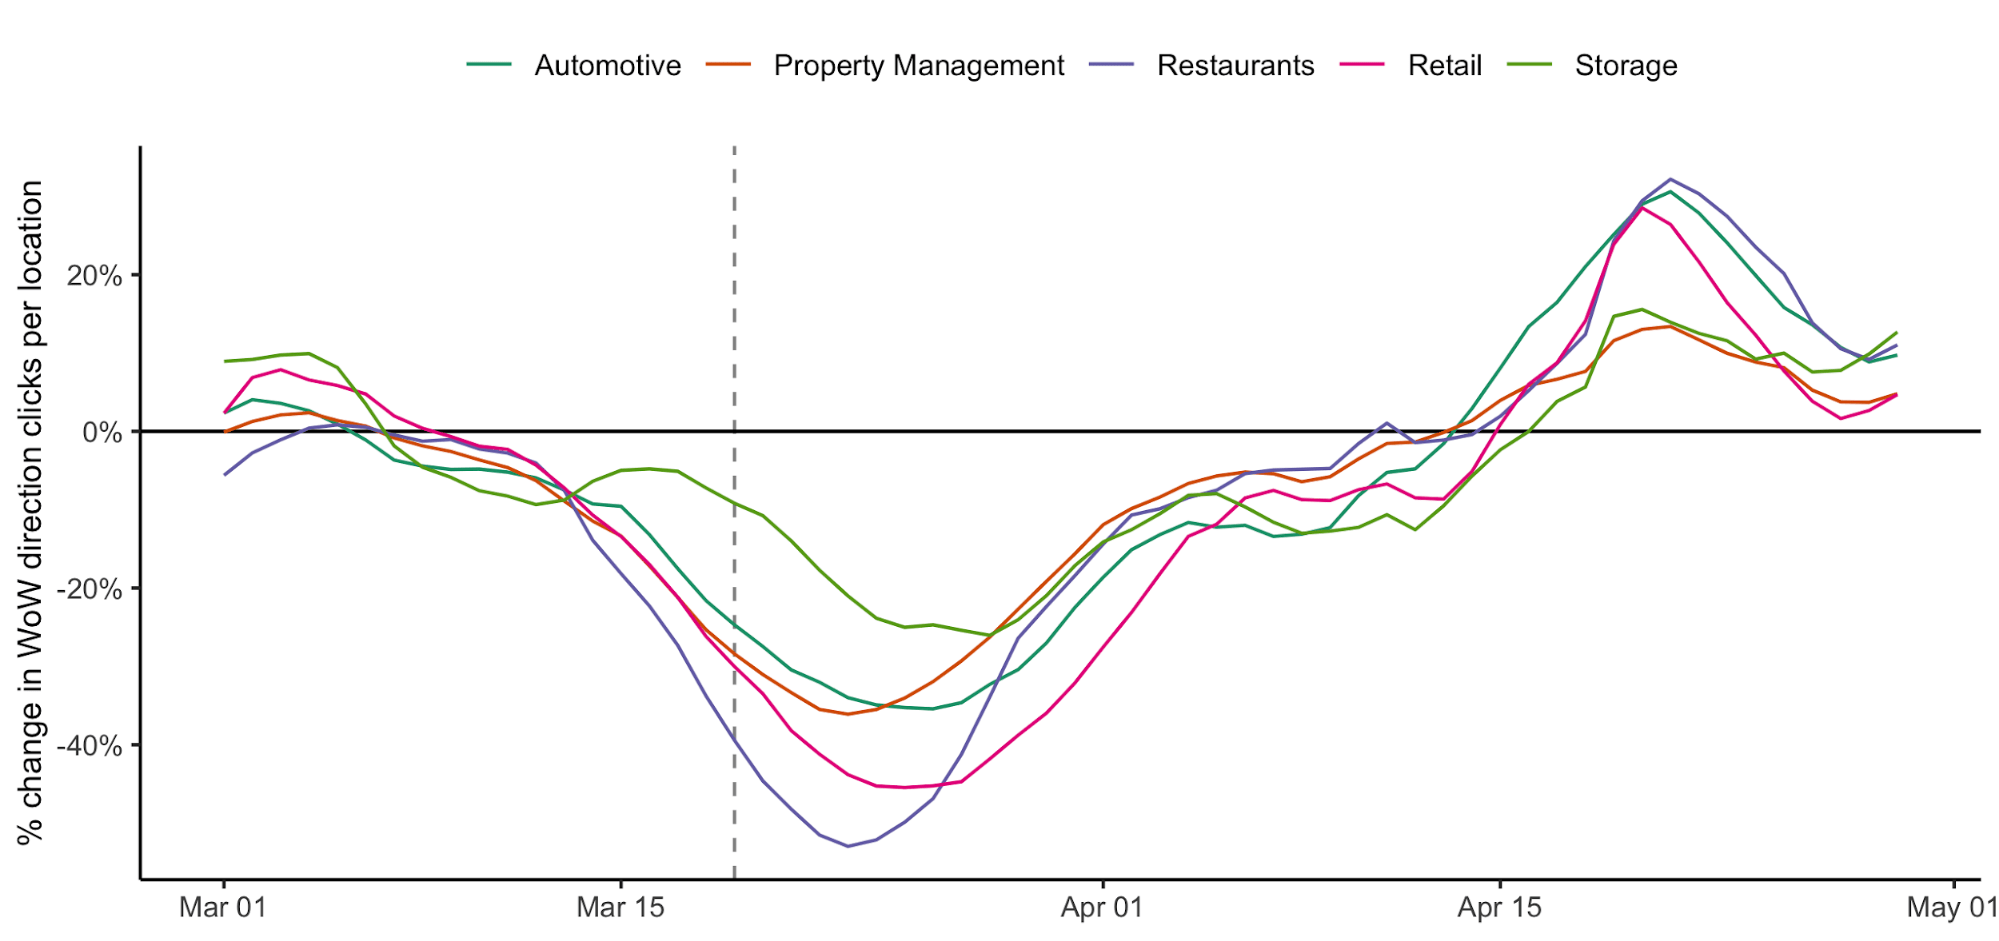
A gradual recovery for all categories in April
Percentage Change in week-over-week clicks per location
![]()
Percentage change in GMB directions clicks
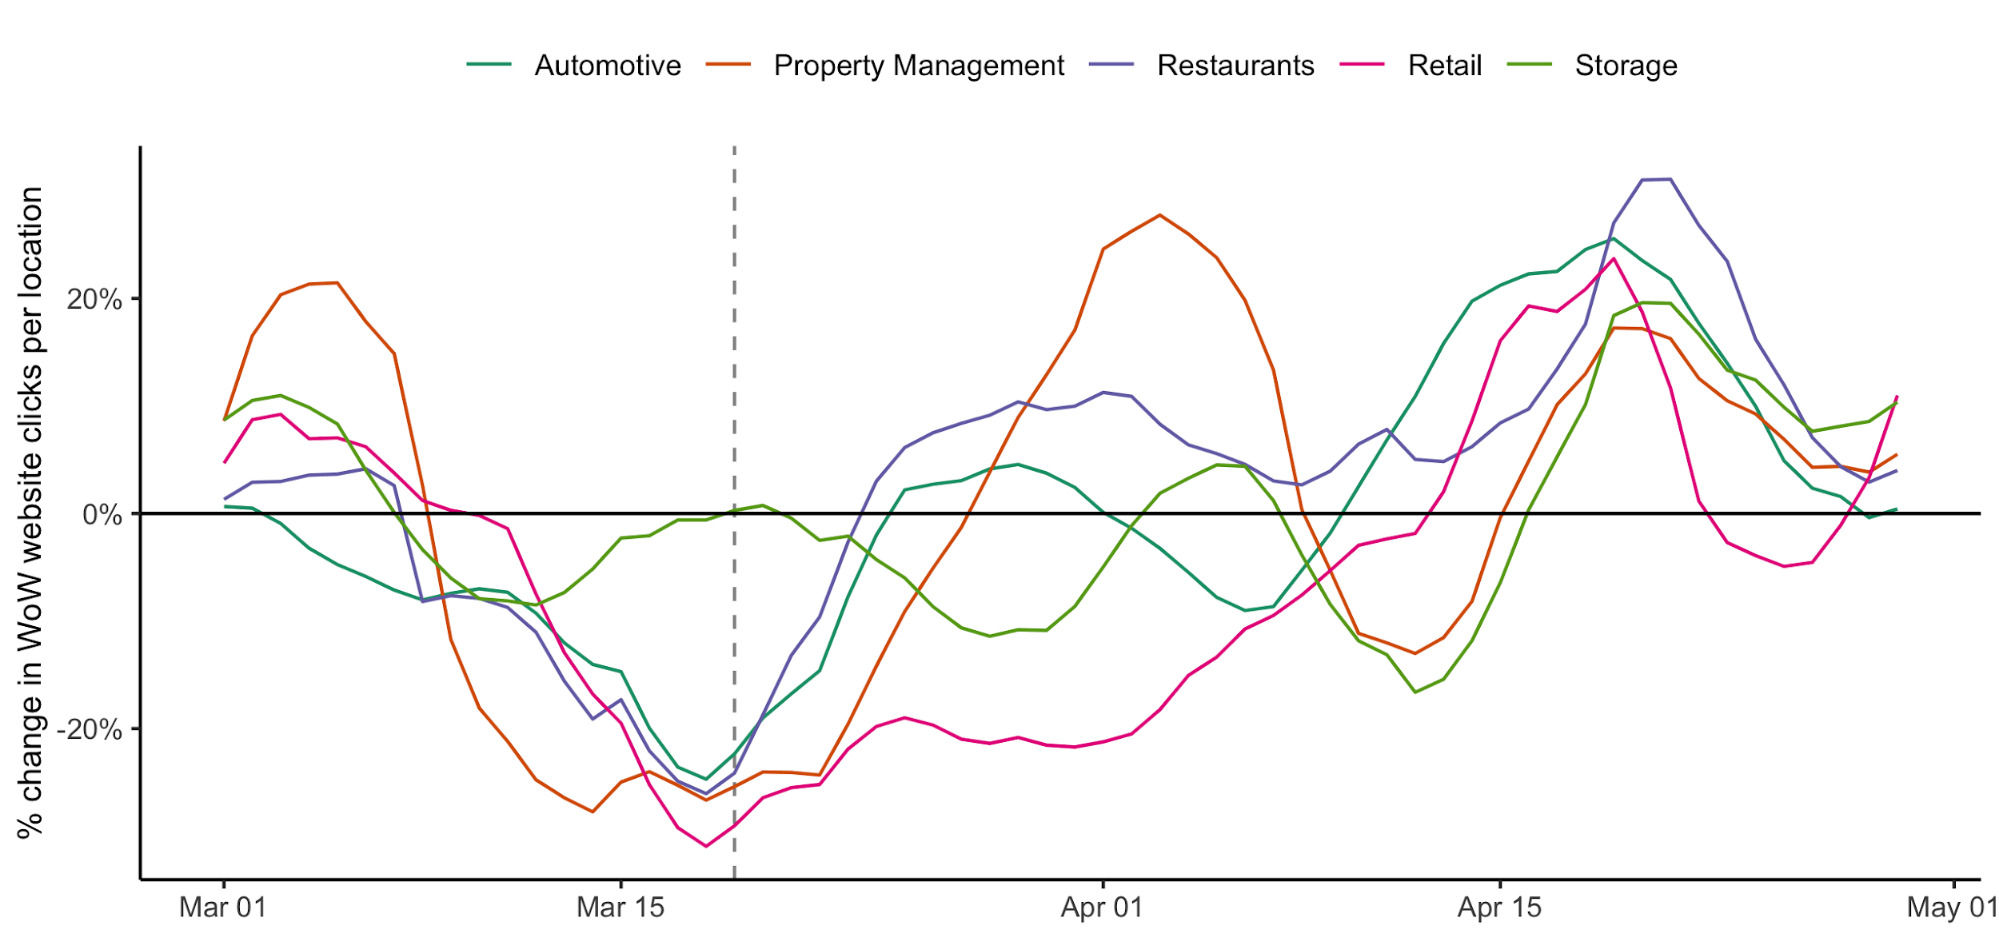
![]()
Percentage change in GMB website clicks
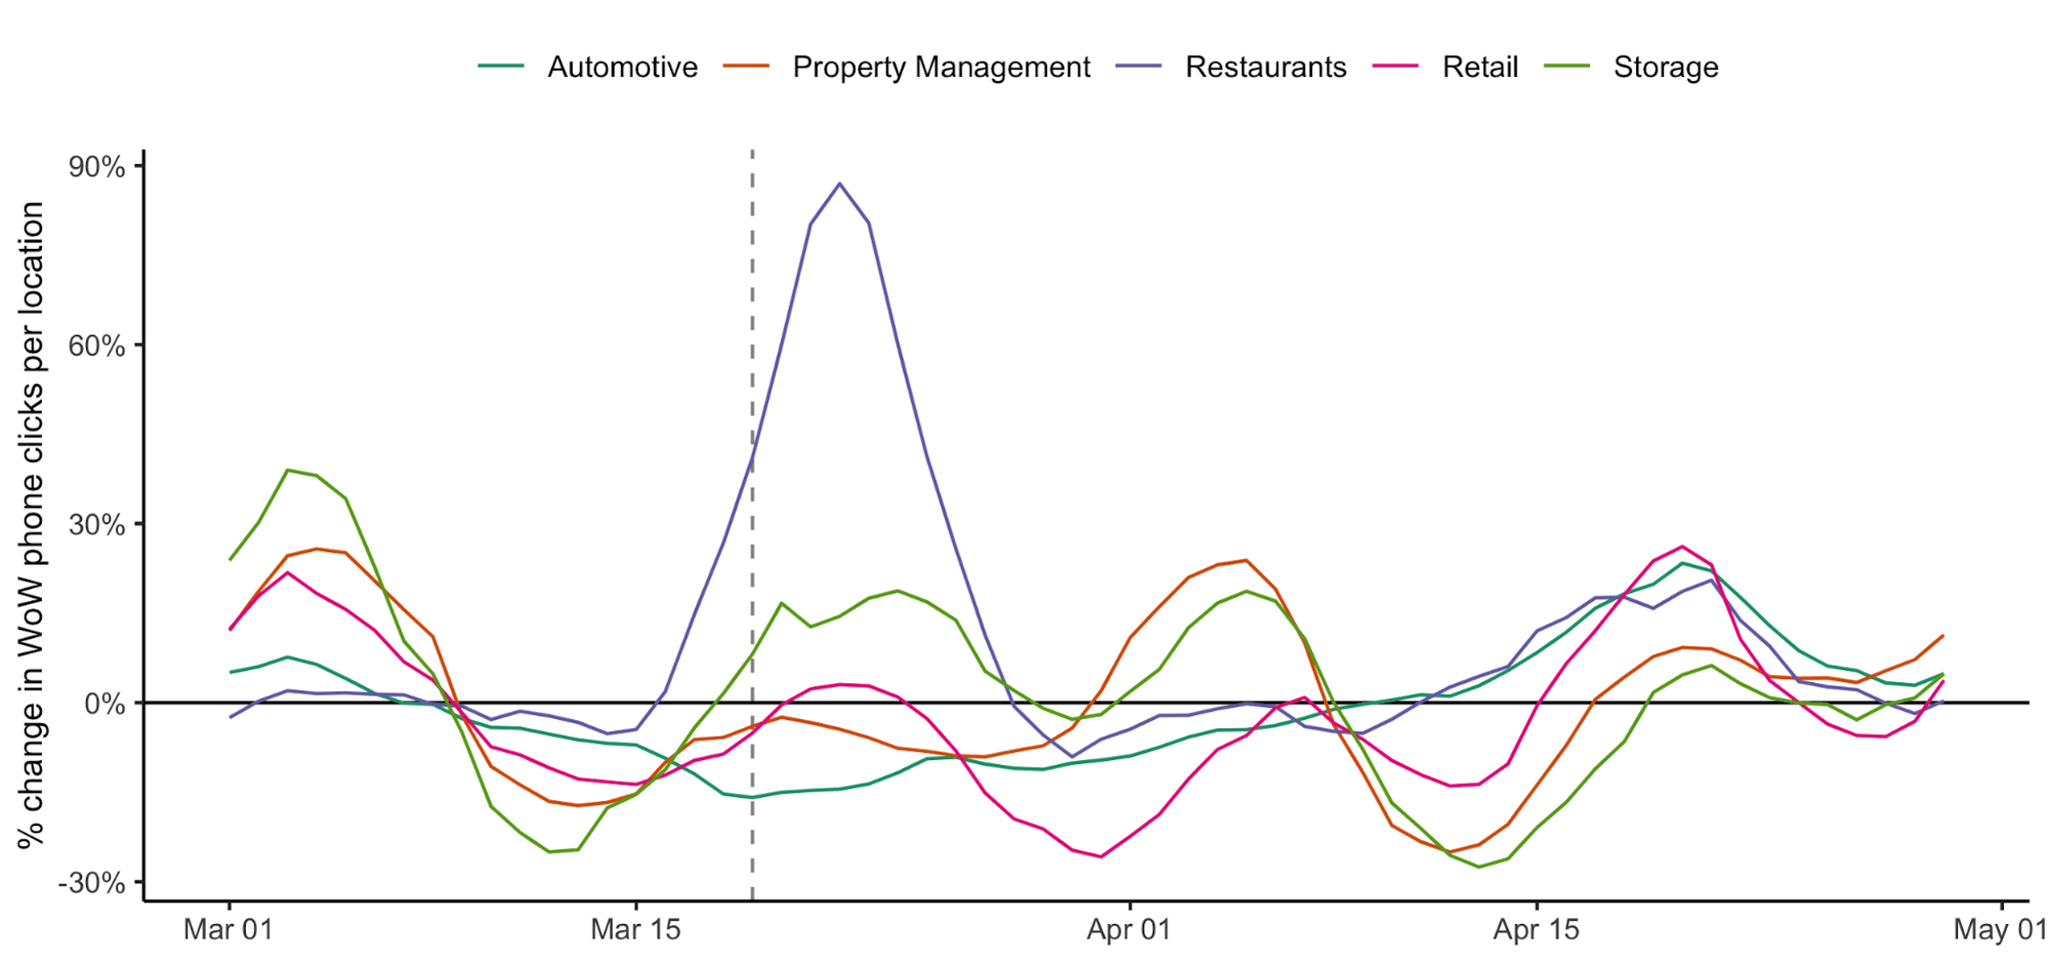
![]()
Percentage change in GMB phone clicks
A closer look at automotive, retail, and restaurants
Automotive
Throughout April, automotive showed the strongest rebound of any industry when it comes to GMB performance. As April progressed, we saw a steady increase in people viewing dealerships’ GMB listings and then taking action by clicking to get more information such as driving directions and phone numbers.
Why? A few factors may explain the turnaround. Across the United States, depending on how states enforced their shelter-in-place mandates, a number of auto dealerships remained open, many for service exclusively, but others for both sales and service.
Automotive vs. Non-Automotive: Percentage change in week-over-week clicks per location
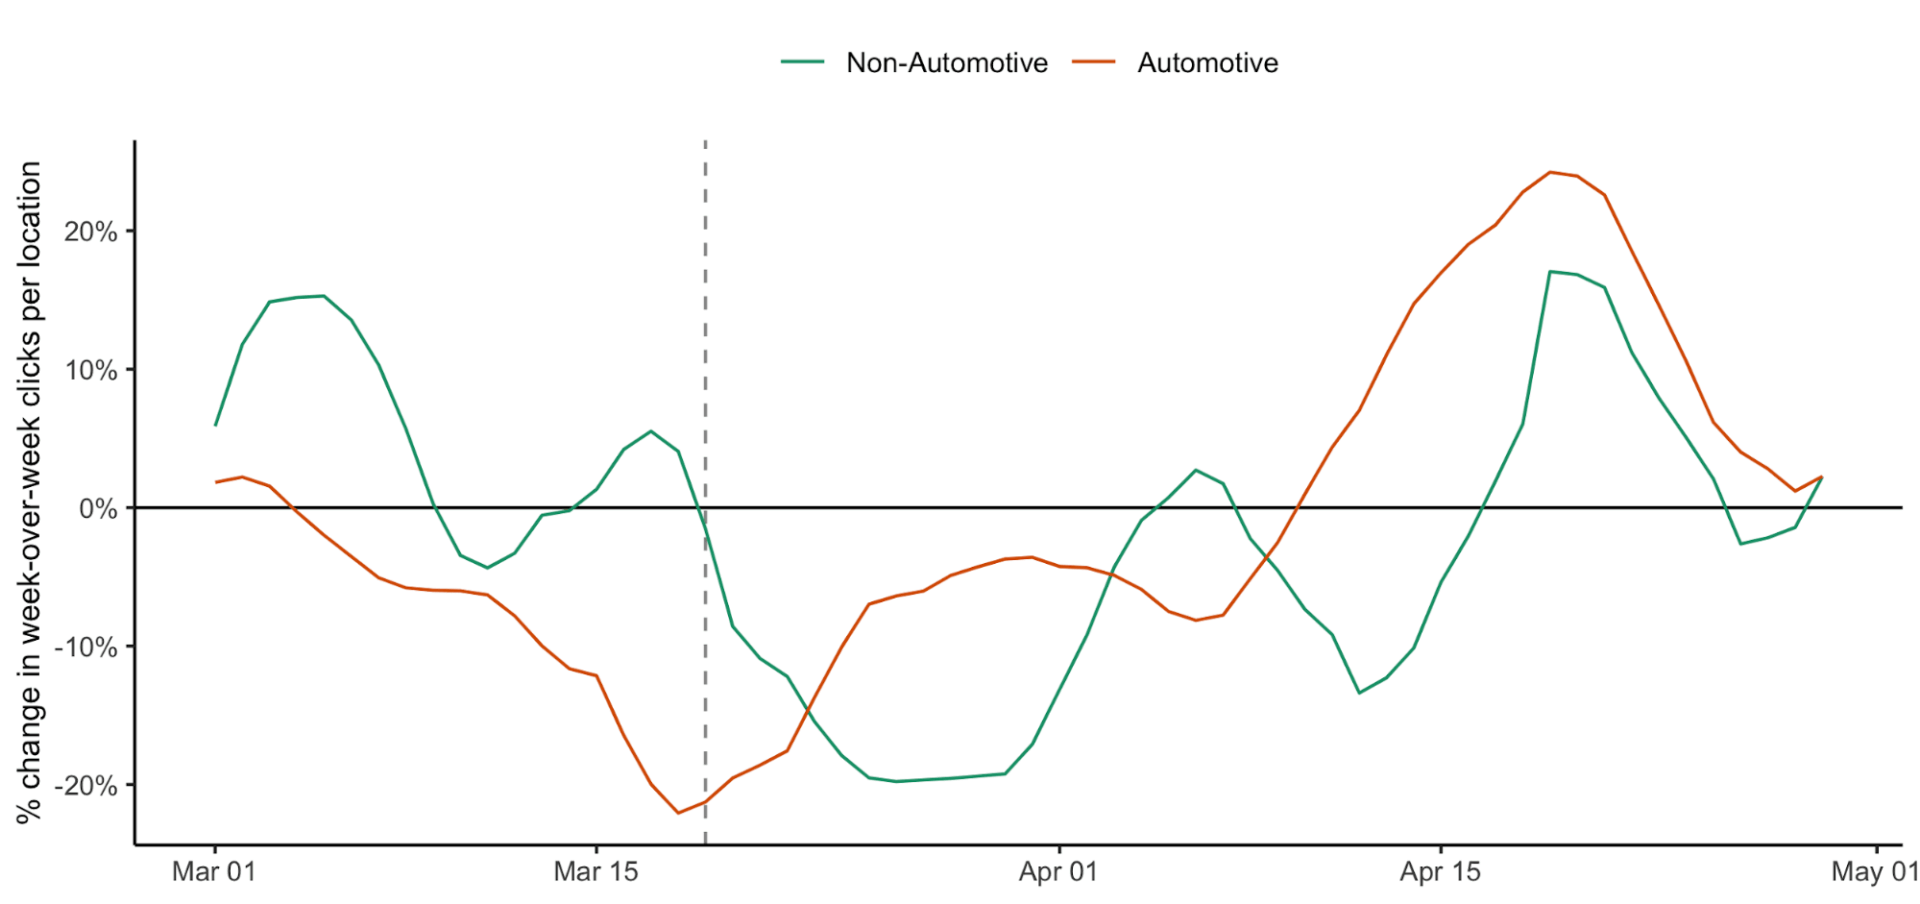
The data shows that people want to shop and get their cars serviced however they can.
For their part, dealerships have adapted, too, by offering more online tools (e.g., test drives via video) and adopting practices such as concierge services and the delivery of automobiles directly to consumers. (Many dealerships had been offering more flexible buying options before the pandemic, but COVID-19 accelerated the uptake on a larger scale.) Dealerships have also acted to assure customers that their service departments are safe and sanitary.
Unfortunately, as a whole, the automotive industry experienced a drop in sales during the first quarter. Other factors counteracted consumer interest, namely the economic slowdown that quickly took hold as the pandemic spread. Automotive, like many other industries, felt the effects of COVID-19 on the bottom line. But our data suggests that things could have been worse.
On a related note, customer reviews are returning to automotive GMB listings – and review sentiment is positive. Google had suspended customer reviews across the board from March 20 to April 9 and then announced their reinstatement. Our analysis shows that throughout April, customer reviews began to return measurably in automotive to the point where, at the end of April, volumes were 44% of where they were on March 1. By contrast, for most other industries, Google reviews were being published at a much slower rate.
Automotive has been seeing strong customer review sentiment in recent weeks. We analyzed nearly 14,000 reviews of automotive dealerships conducted during the pandemic. From those reviews, we found that overall sentiment was generally very positive (89% positive versus 11% negative). Customers have been pleased with how dealers have managed their showrooms and how service representatives have been in addressing the pandemic.
Customer revews returning to GMB listings
Google had suspended reviews on March 20, and reinstated them on April 9.
Sentiment is positive:
89% positive reviews and only 11% negative reviews
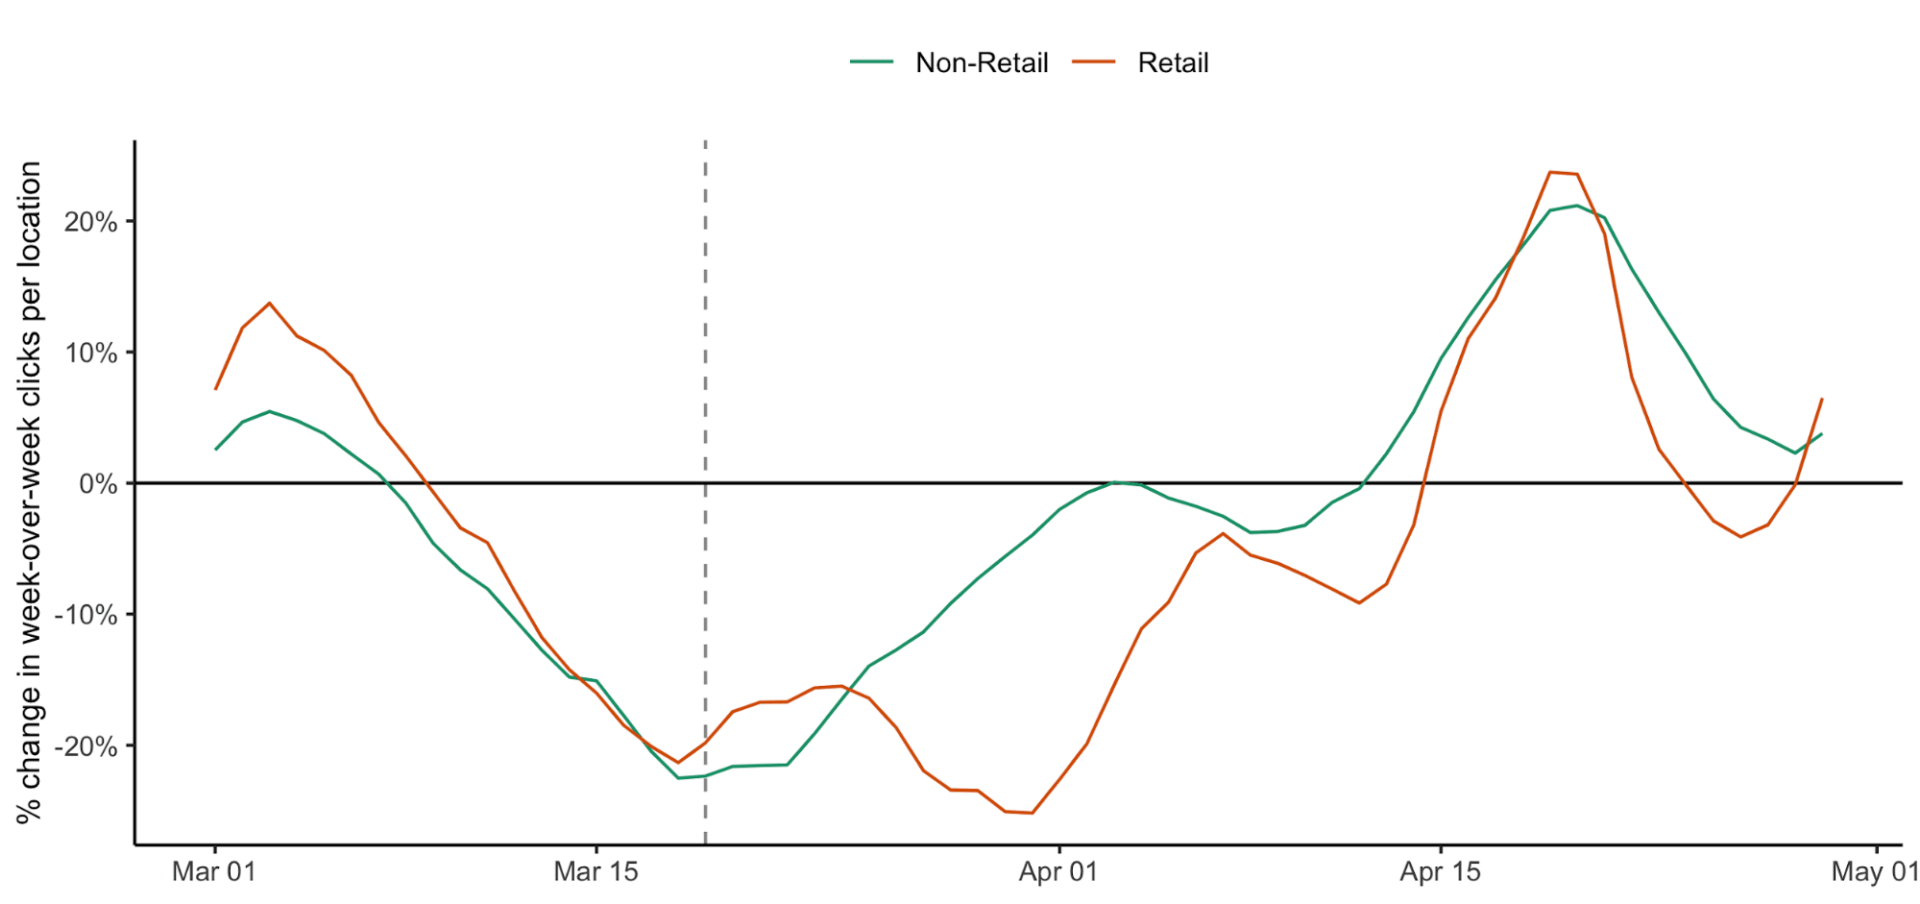
Retail
First, the bad news: by now we all know that in March and April, retail experienced the largest two-month decline in sales ever recorded. Retail GMB clicks reflected this reality, with a 46% drop. In April, as retail sales dropped even more dramatically, GMB clicks actually showed an upward trend — but a very gradual one that did not start to take hold until later in the month.
So what was going on in March and April?
It’s likely that in March, people hunkered down after a surge of panic buying in stores. Then, as they adapted to living at home for days and weeks at a stretch, they went out less and bought more online. As more consumers figured out how to purchase online, they had less of a need to call or drive to retailers and went directly to their ecommerce sites. Indeed, the online grocery industry and online sites such as Amazon saw a surge of business in the first quarter of 2020.
In April, GMB click performance continued to drop. It was not until midway through April that we saw clicks trending upward. But even when people clicked on GMBs with a potential intent to purchase, there were few places they could actually visit because of mass store closures, So consumers turned their attention online, and indeed ecommerce saw a surge of activity in March and April.
Retail vs. Non-Retail: Percentage change in week-over-week clicks per location
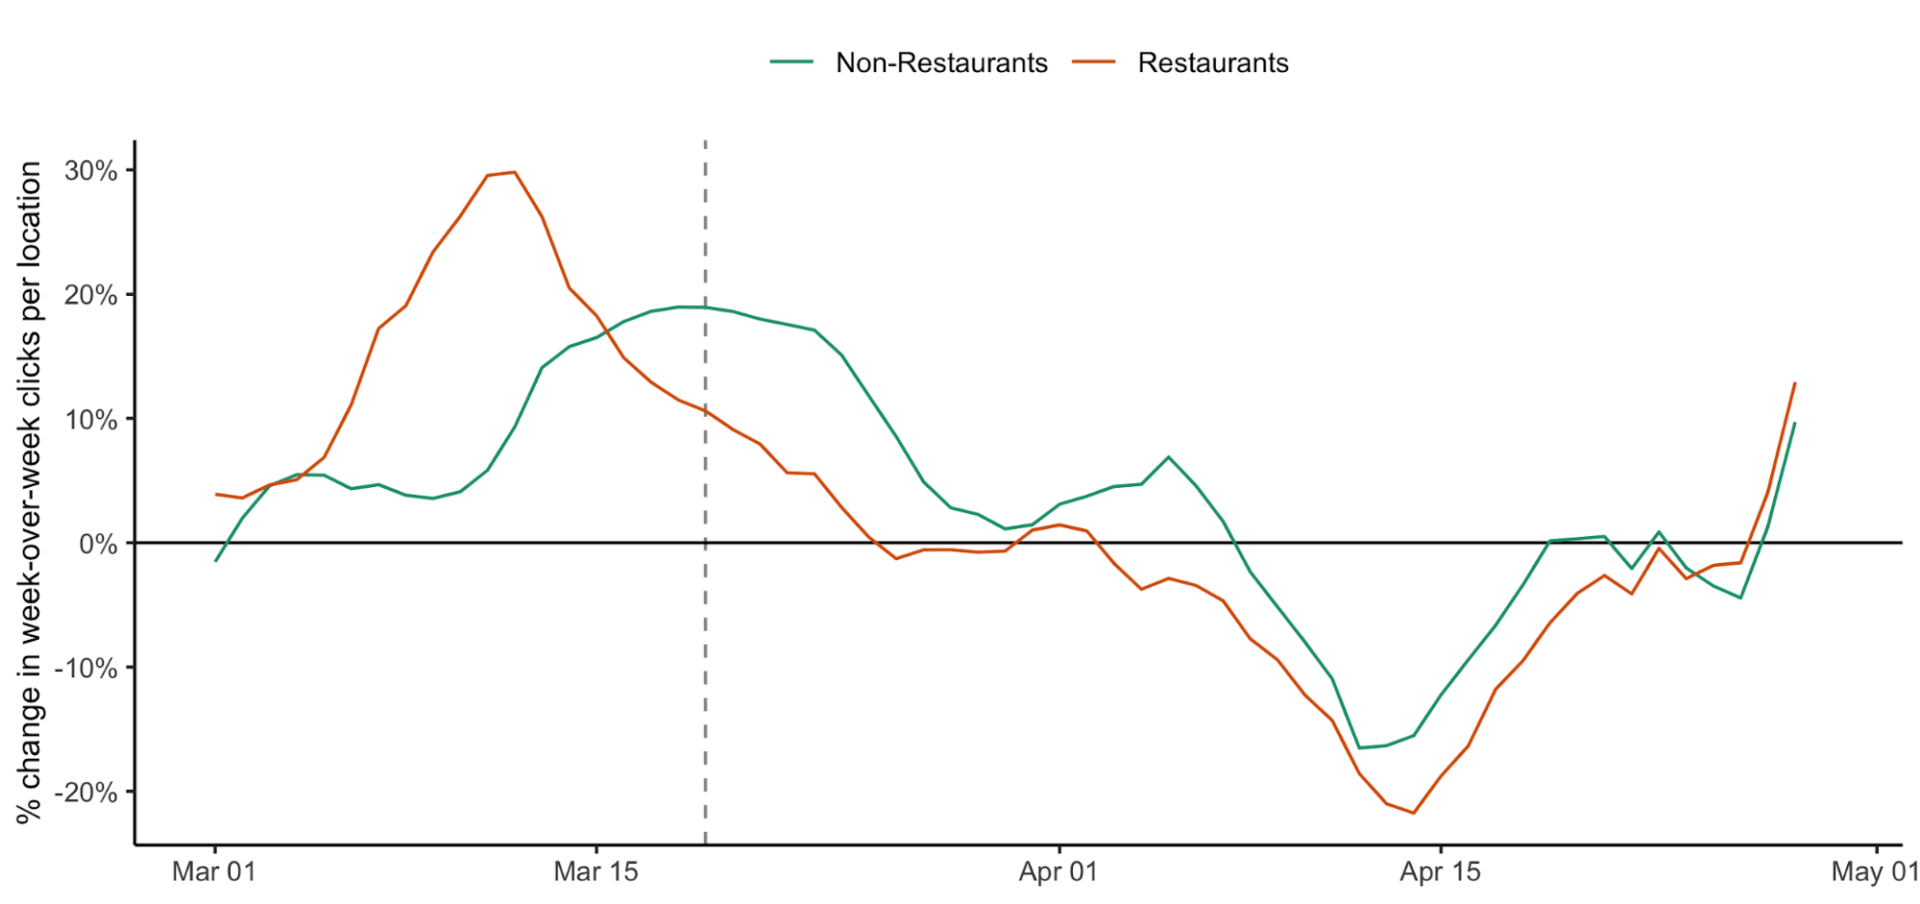
Restaurants
Restaurants and bars lost half their business in March and April. As the pandemic spread throughout the United States and states enacted shelterin-place mandates, people settled into their homes and began looking for options to have food delivered or ordered for take-out.
At first, it was not always clear that it was possible to order from a restaurant, or whether restaurants were even open. As consumers better understood their options, they transitioned to calling restaurants and placing food orders. That’s possibly why GMB phone clicks began to spike around the middle of March, but they declined near the end of March.
Conceivably consumers were adapting to ordering online or by then had found satisfactory answers to their initial questions. We also saw a sharp decline in GMB impressions followed by a bottoming out at the end of March. It’s likely that as restaurants updated their GMB listings with COVID-19 related attributes (such as special hours of operation and the availability of no-contact delivery) that people were finding GMB listings to be more reliable sources of information. And, the bottoming out may reflect a broader desire to support local businesses.
As consumers better understood their options, they transitioned to calling restaurants and placing food orders.
Restaurant vs. Non-Restaurant: Percentage change in week-over-week clicks per location
Consumers respond as restaurants adapt
With restaurants aggressively promoting curbside pickup and delivery, consumers used GMB to learn more about what’s available.
April witnessed a decline in GMB activity followed by an upward trend later in the month. It’s not entirely clear why clicks were trending downward in April following an apparent bottoming out at the end of March. But the upward trend later in April is clear.
By April, restaurants had more aggressively embraced take-out, curbside pick-up, and delivery models (and restaurants with drive-through service pre-COVID-19 mobilized their workforces to support that crucial option). Restaurants aggressively promoted these options, and consumers responded.
Mind Your GMBs
Regardless of your industry, managing GMB listings is even more critical than it was prior to the pandemic. Consumers are still actively using GMB to learn about your business, and Google has been shifting quickly with changes in how your data can be managed. As searches pick back up, it will be important to feature accurate data and informative content. Ideally, you should monitor your listing daily. We suggest you keep a checklist of essential assets to review covering essential data and content such as:
- Your basic location information. Even this data changes, as we have seen with COVID-19 forcing businesses to change their operating hours.
- Attributes. This is information that may set you apart from competitors, such as whether your location caters to children or whether your employees speak multiple languages. Are they up to date? Are you capitalizing on special attributes for COVID-19?
- Ratings and reviews. Are you responding to them? As we blogged recently, even though Google suspended the posting of customer reviews for weeks, reviews are coming back.
- Q&A. Are you providing quality owner verified answers before users respond with less than ideal ones?
- Visual content. Has your location rolled out new merchandise or a new menu item you want to highlight, for instance?
- Offers. As noted, are you updating your content to announce sales and special events?
The above list is just scratching the surface of course. Our blog contains more tips on managing your GMB listing. It’s clear that GMBs remain essential to managing your business. Reputation.com is here to help you.
Footnote: we arrived at the % change figures by taking a single week day and comparing it to the average of seven previous comparable week days. For example, if a GMB registered 100 views on Thursday, March 26, we compared that number to the average of the previous four past Thursdays (March 19, 12, and 5; and February 28). Doing so provides a more granular view that accounts for variances in days of the week.
1 Reputation.com, “2020 Automotive Reputation Report”
2 Moz, “2018 Local Search Ranking Factors.”